Crypto trading / Support and resistance trading strategy
Hi dear trader.
Support and resistance strategy is one of the most common strategies in trading. And by far seems to be one of the strategies that professional traders use. Here in this article, we will go through how you can use Aicoinpal to do Support and resistance strategy. Note: There are many support and resistance strategies in this article we will discuss only one of the patterns.
What is a support and what is a resistance?
Support and resistance lines are price action zones in between normally price rises up and down. Usually, these support and resistance levels are levels where a couple of times traders test out each zone to see whether the market has more potential to go upwards or downwards. This will give traders a nice chance to trade on these levels to gain profits predicting a price move downwards from a resistance zone and price to bounce back upwards from support levels. This would be a higher probability guessing of a bounce up or down, but the idea is not that traders get trades positive each time, it's more of a higher ration, that in these support and resistance levels there is a higher chance to predict the market. See the image below.
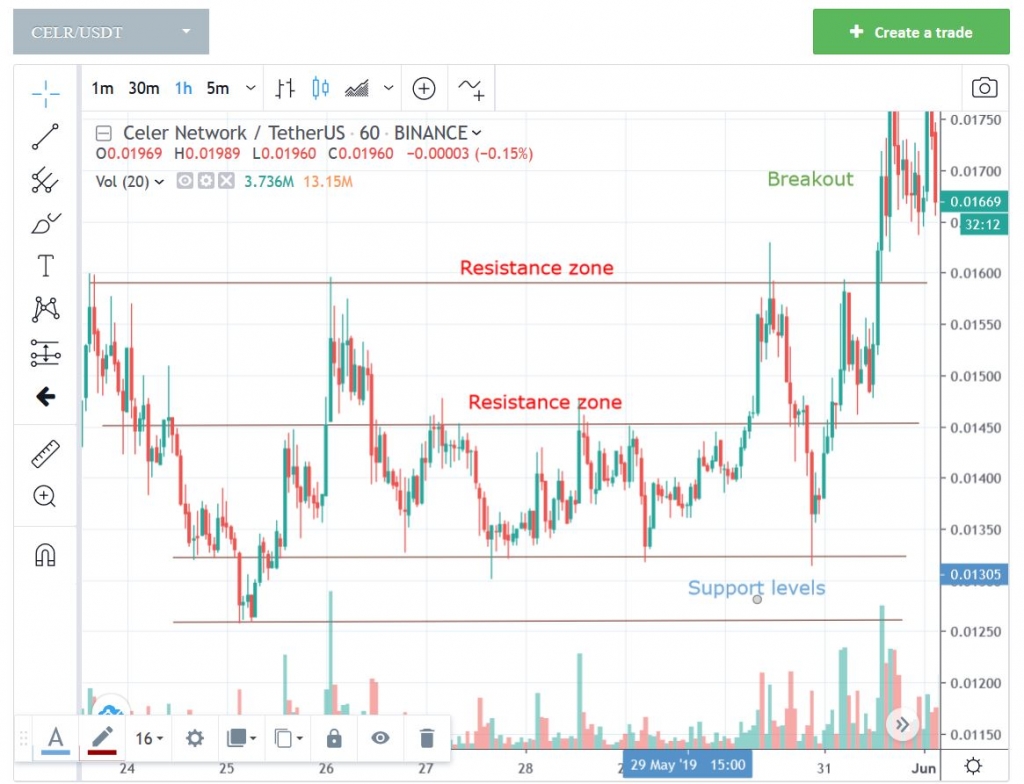
Here we can see that a price action tested resistance zone 3 times before it broke above, and support levels got tested 4 times before the price broke above. So giving a nice chance of trades in the 3rd and 4th supporting levels.
Unlike classical markets, crypto tends to have more volatility and more noise which would lead to only approximate support and resistance levels. There fore trading at these levels could lead to a much greater fallback and then a rebound. So many traders would use a no stop-loss feature or use a much larger stop loss.
How ever it's not about getting it right all the time, it's more about odds and chances. How many times do these support and resistance tradings you get it right? This will eventually lead to a more positive balance than negative.
Finding these patterns is not that difficult, for some markets it's easy to find support and resistance areas and to some, it's a little challenging.
When a price goes above the resistance area and holds there until a candle closes it is called a break out meaning that the price will go higher to test higher resistance levels. And in this case, a resistance to which breakout happened will become a support area. And the same applies if a price breaks below a support area.
So how to trade in this using Aicoinpal provided tools?
First, draw the trend lines and support resistance lines that you can find.
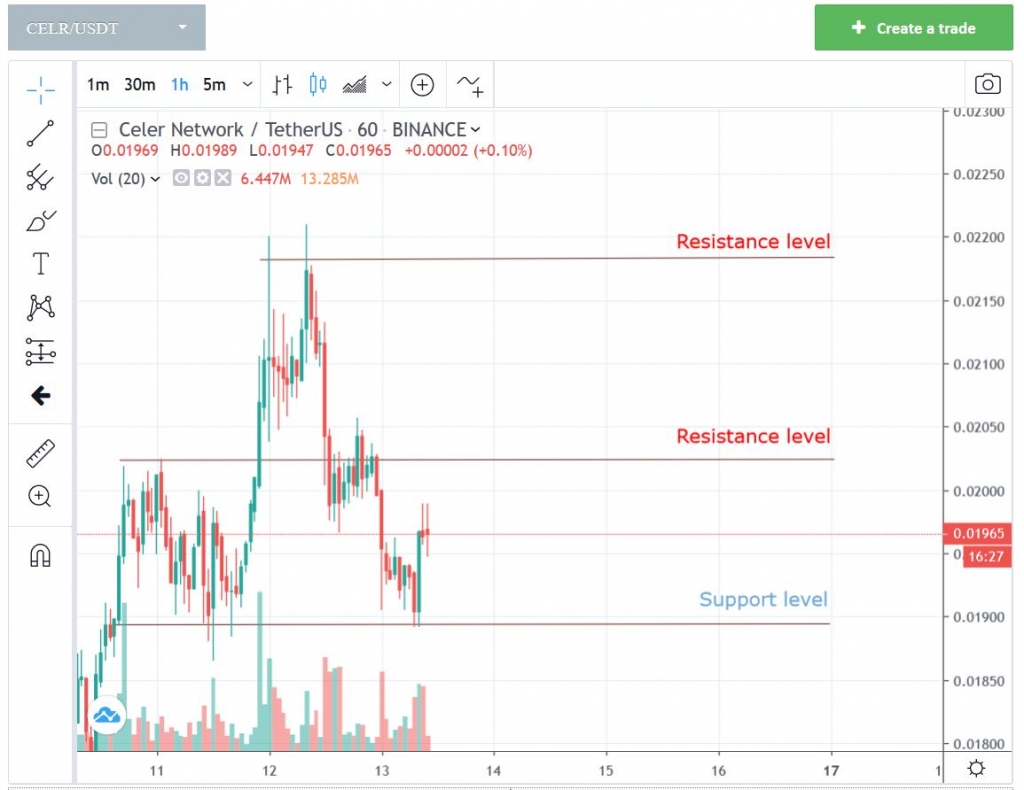
Here you can see we have 1 Support level and 2 Resistance levels.
Such a case also happens on diagonal trend lines like in the image below.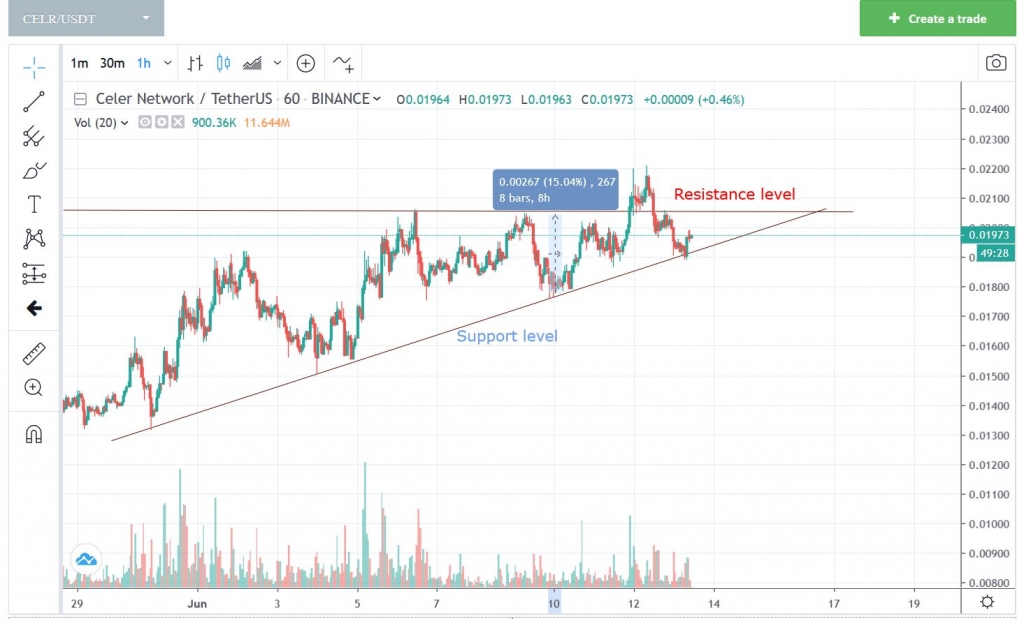
Trading on-trend lines as diagonal support lines and resistance lines are more common in up trending markets.
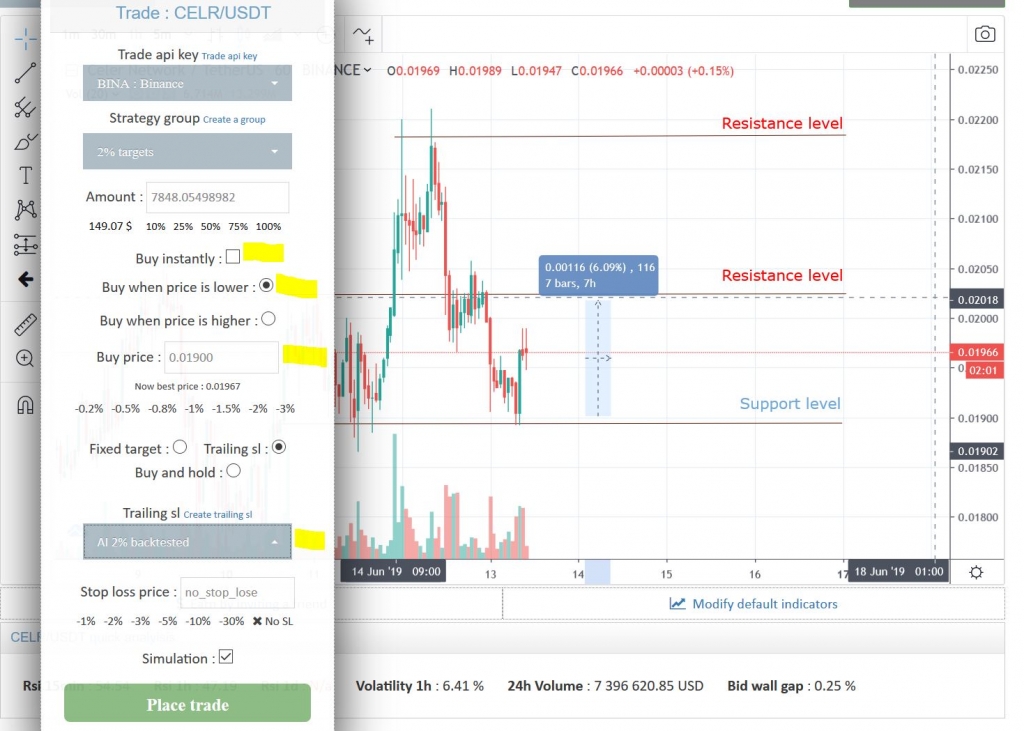
For safer trading, it is easier to predict that a price next time will re bounce from the area of 0.01900 to the resistance level approx. 0.0203 putting a sell signal. What would many traders do is wait for it before selling it at the first resistance giving us a nice chance to hold the trade until the price moves higher to test the next resistance level. Before you decide to make a trade it is necessary to decide how much of capital you want to place on trade and what kind of a trailing stop loss to use. To do this we need to check the volatility of the market. Use the measure tool at the left side and measure the distance between the support and resistance level.
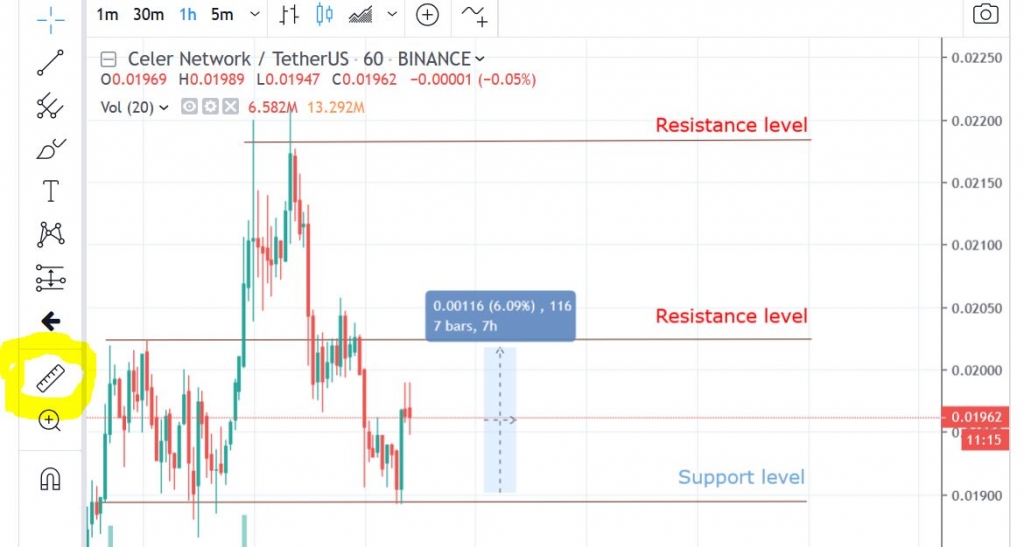
Here you can see that the distance between support and resistance level is 6% Which is quite a good opportunity for a trade. So this could indicate to make it a safe trade we could use the 2% trailing stop loss giving us a nice chance of at least a 2% target. Even if the market bounces back from the support level there are still chances that the market could not reach the 6% resistance level, but using a 2% trailing stop loss could increase our chances of getting the profit what we need. So the price now is 0.01962 let's place a trade.|
Click on create a trade on the top right corner of your chart.
Uncheck the Buy instantly option. And click on the buy lower option.
Here you will need to input at what price you want the system to buy your coin. Fill in the support level price which is 0.019 you can place a couple of trades for example 3 trades. one with 0.0195 another with 0.019 another with 0.0189 To make it a more adjusted deal so that you have a higher chance to enter the trade with a better price Some times the price bounces from support levels not even touching the support level, this will cause you to miss a trade. And some times the price drops a little below the support level allowing you to get the coin at a better price. Keep in mind that the price can go lower and lower without a rebounce so in this case you need to plan your risk how much you can spend on trade and what is the maximum that you can lose on a trade. Trading is all about probability and managing risks.
So choosing a proper trailing stop loss means seeing how great is the market volatility measuring it and deciding what is the risk you can take. For example, if market Volatility is 1% this could mean that the possible safe trade profit is so small that there is no reason to enter the trade. If volatility is above 10% between support and resistance it could be a nice trade opportunity.
This kind of strategy applies to all time frames. Ass well as on 5m 1h and 4h charts.
Once you have filled in all the trade settings you can "Place trade"
And the system will execute your deal once the price falls to support level, automatically buy the coin, and when the price starts going upwards the system will automatically detect the sell position and sell it according to the trailing stop loss you have chosen. You can make your trailing stop loss strategy if you wish. You can do that on the left side section Trailing sl.
What are the risks?
If the price breaks below support and you do not use stop loss it could end up in a larger consolidation period until the trade recovers.
If you use the stop loss for example 2 - 3% the price could fall below support, hit your stop loss and then quickly recover. You need to be consistent and backtest this strategy for 100 deals or so, to see the success ratio for such a strategy. But using a trailing stop loss has proven to increase your success greatly because there is always a chance for the price to break out and go higher to let's say 20% + more. Then a trailing stop loss will trail your profit and on a retracement will automatically sell giving you a more than 6% profit.
You can reduce risks by placing smaller amounts on trade and each support level down create a new trade. The market will recover at some point and until then you could make several more trades and get back your consolidated investment. So the risks are things you have to manage. As some traders in Aicoinpal don't use stop-loss some use stop loss. Someplace 2% of their capital on trade some 5% it is up to you to become a professional trader, but we can provide you tools that can help you and create new strategies, that will make your trading with more success.
Rent a profitable trading bot
Top 3 traders
Top : 1
ma****@gmail.comAvg Trade time : 6 hours Opened deals : 5 Total deals : 284
Last update: 3 years ago
Top : 2
sa****@inbox.lvAvg Trade time : 6 hours Opened deals : 11 Total deals : 459
Last update: 3 years ago
Top : 3
as****@gmail.comAvg Trade time : 5 hours Opened deals : 3 Total deals : 332
Last update: 5 years ago